U.S. GDP Analysis with Machine Learning
Quick Snapshot
- Role: Data analyst
- Team: Independent research project
- Customers: Economists and analysts examining long-term GDP composition trends
Mandate / Opportunity / Problem Scope
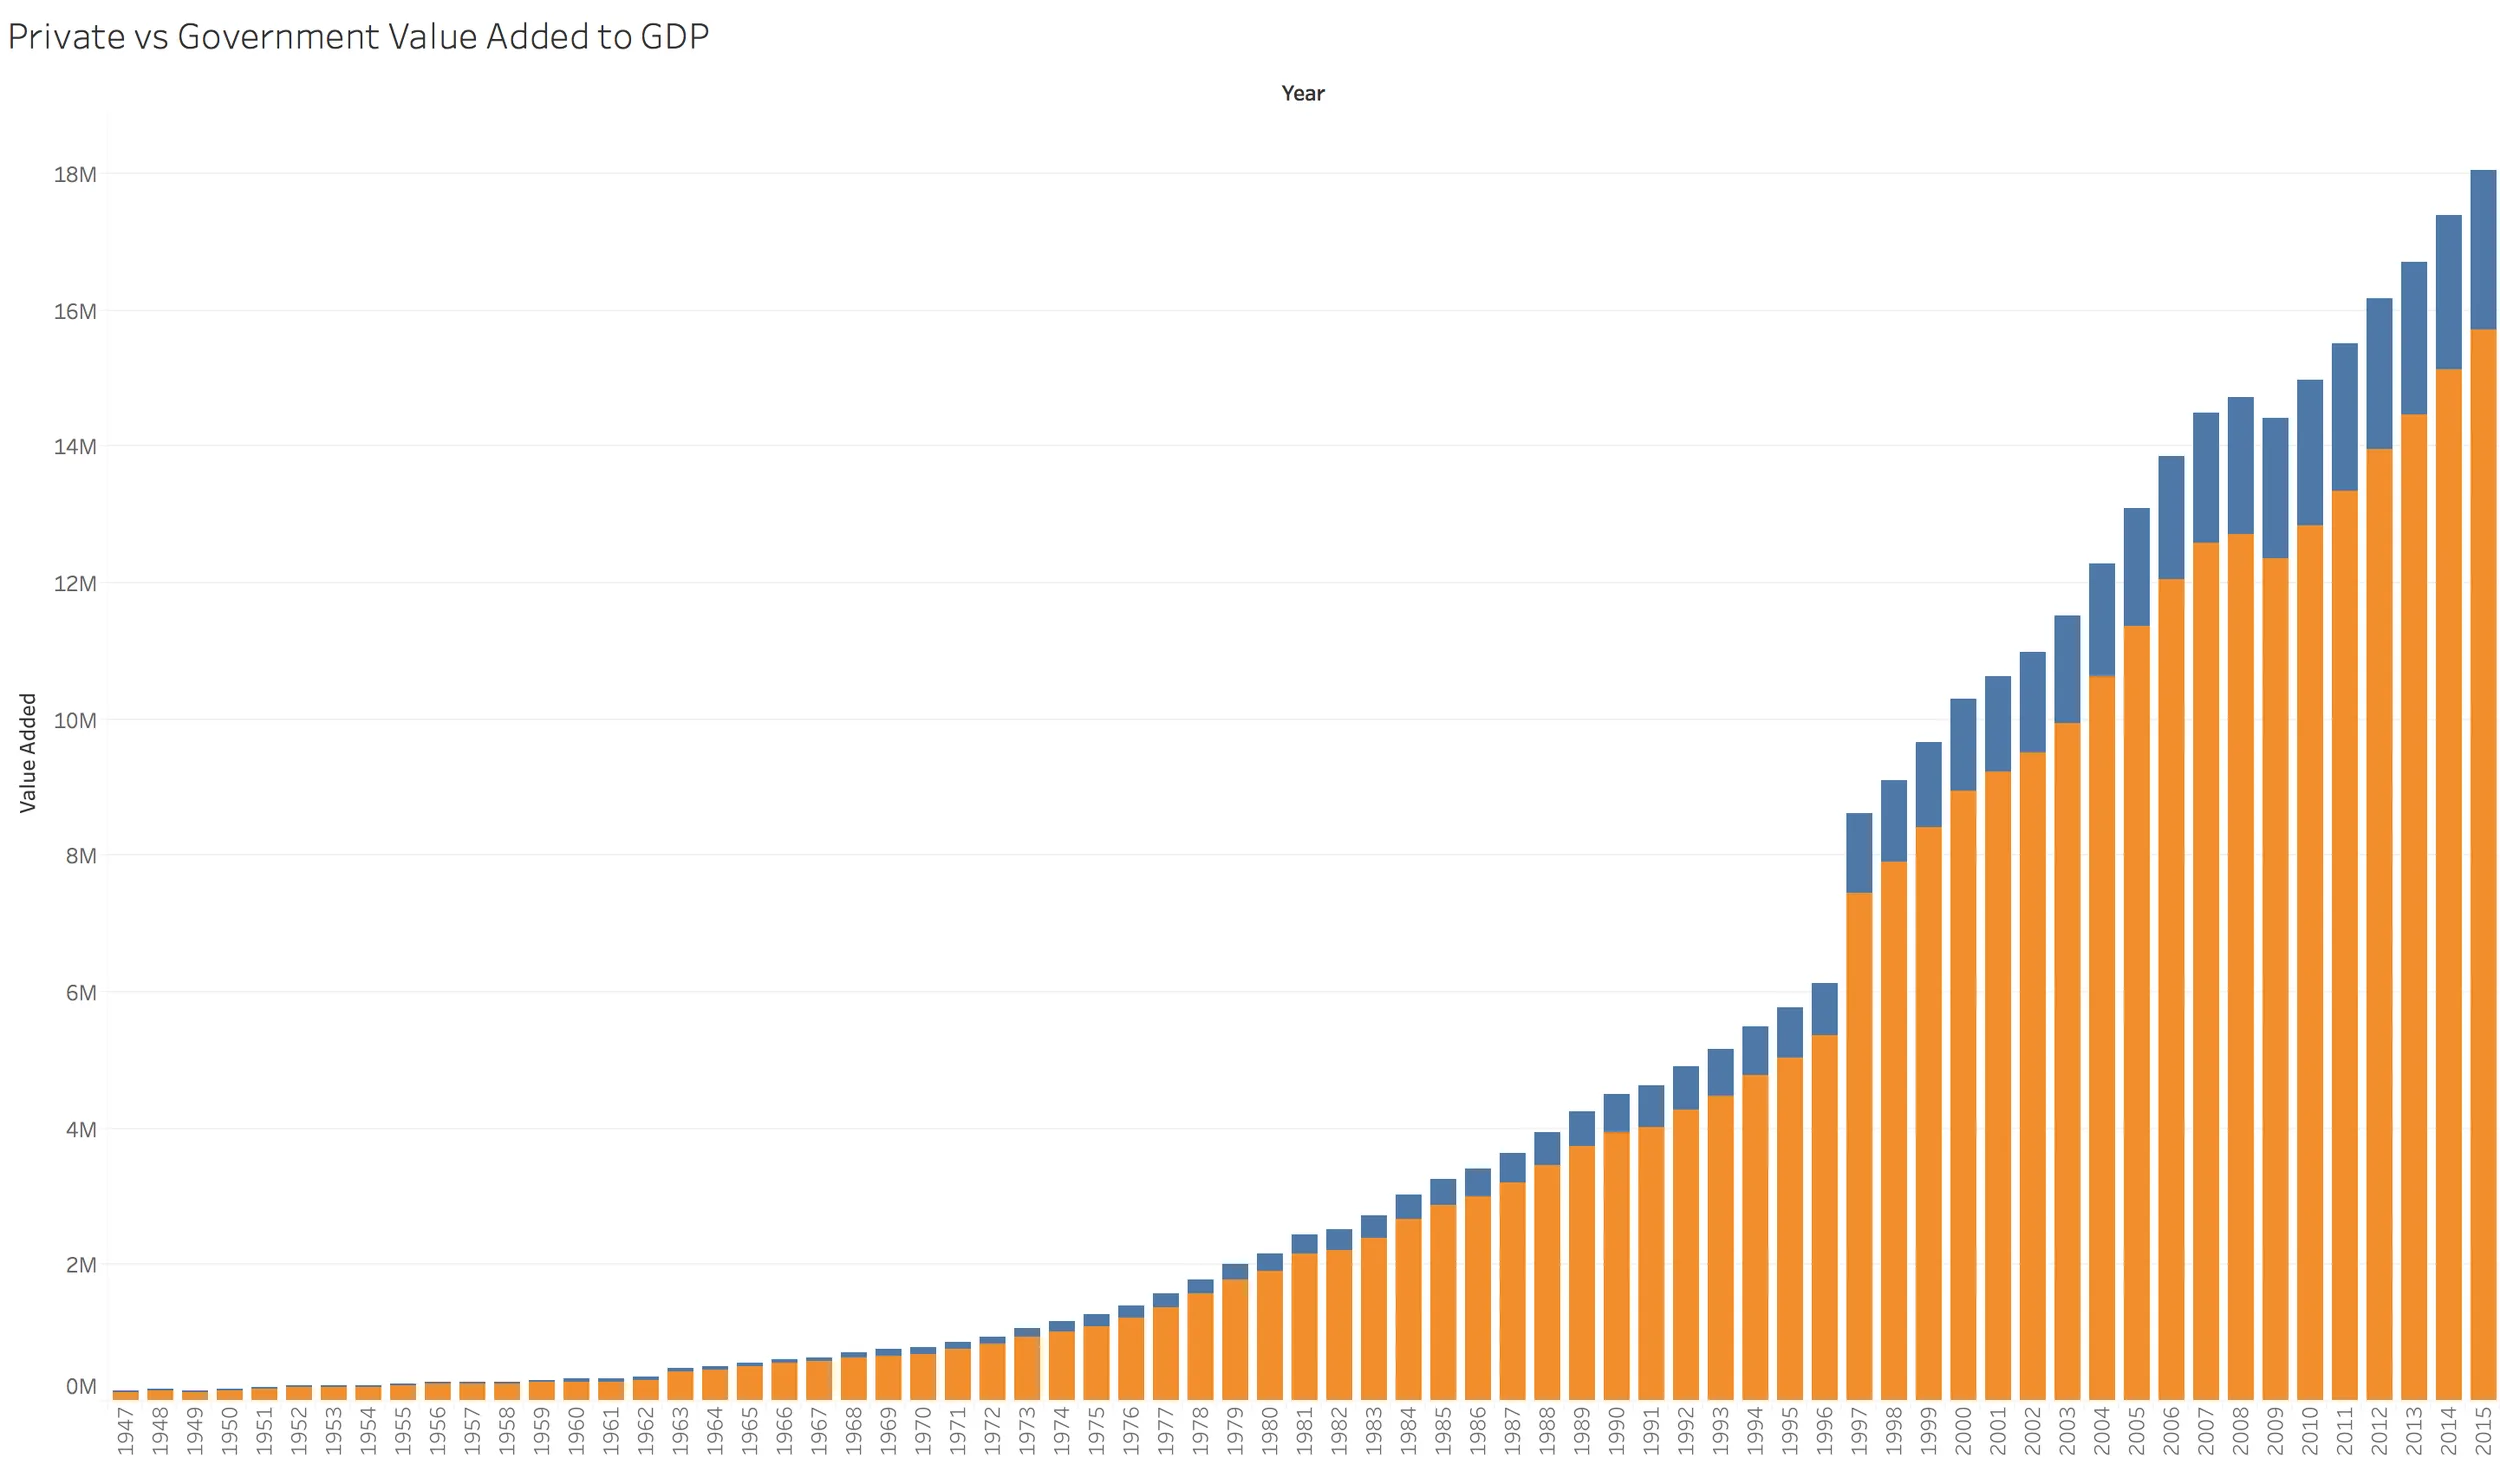
I examined U.S. GDP and its components from 1947 onward to test assumptions about how compensation, taxes, operating surplus, and intermediate inputs evolve over time.

What I Led / Delivered / Highlights
- Gathered raw data from the Bureau of Economic Analysis and normalized it using Excel.
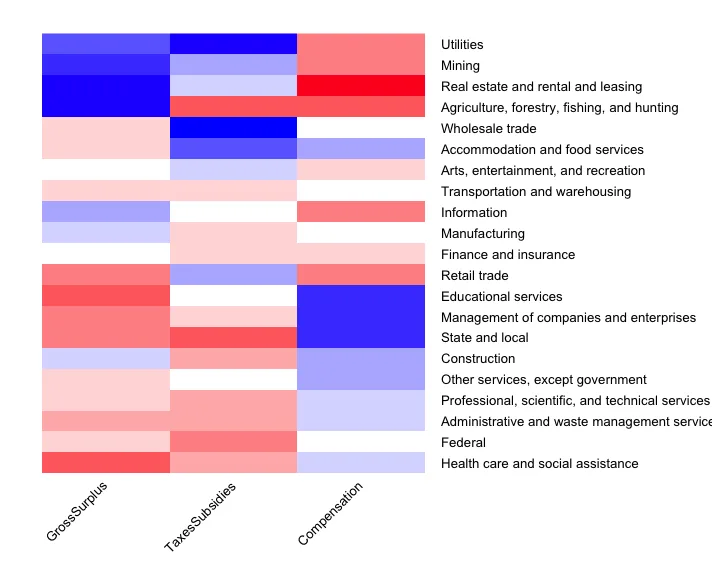
- Reshaped the dataset with custom R scripts, then applied hierarchical clustering to uncover relationships among industries and sectors.
- Visualized findings through heat maps and ratio charts to communicate changes in cost structure and surplus contribution.
Impact / Lasting Value / Takeaway
The work produced an extensible analysis framework for exploring GDP composition, enabling data-driven conversations about structural shifts in the U.S. economy.