Crime & Demolitions in Detroit
Quick Snapshot
- Role: Data visualization researcher
- Team: Graduate information visualization team project
- Customers: City leaders, planners, and residents assessing blight-reduction initiatives
Mandate / Opportunity / Problem Scope
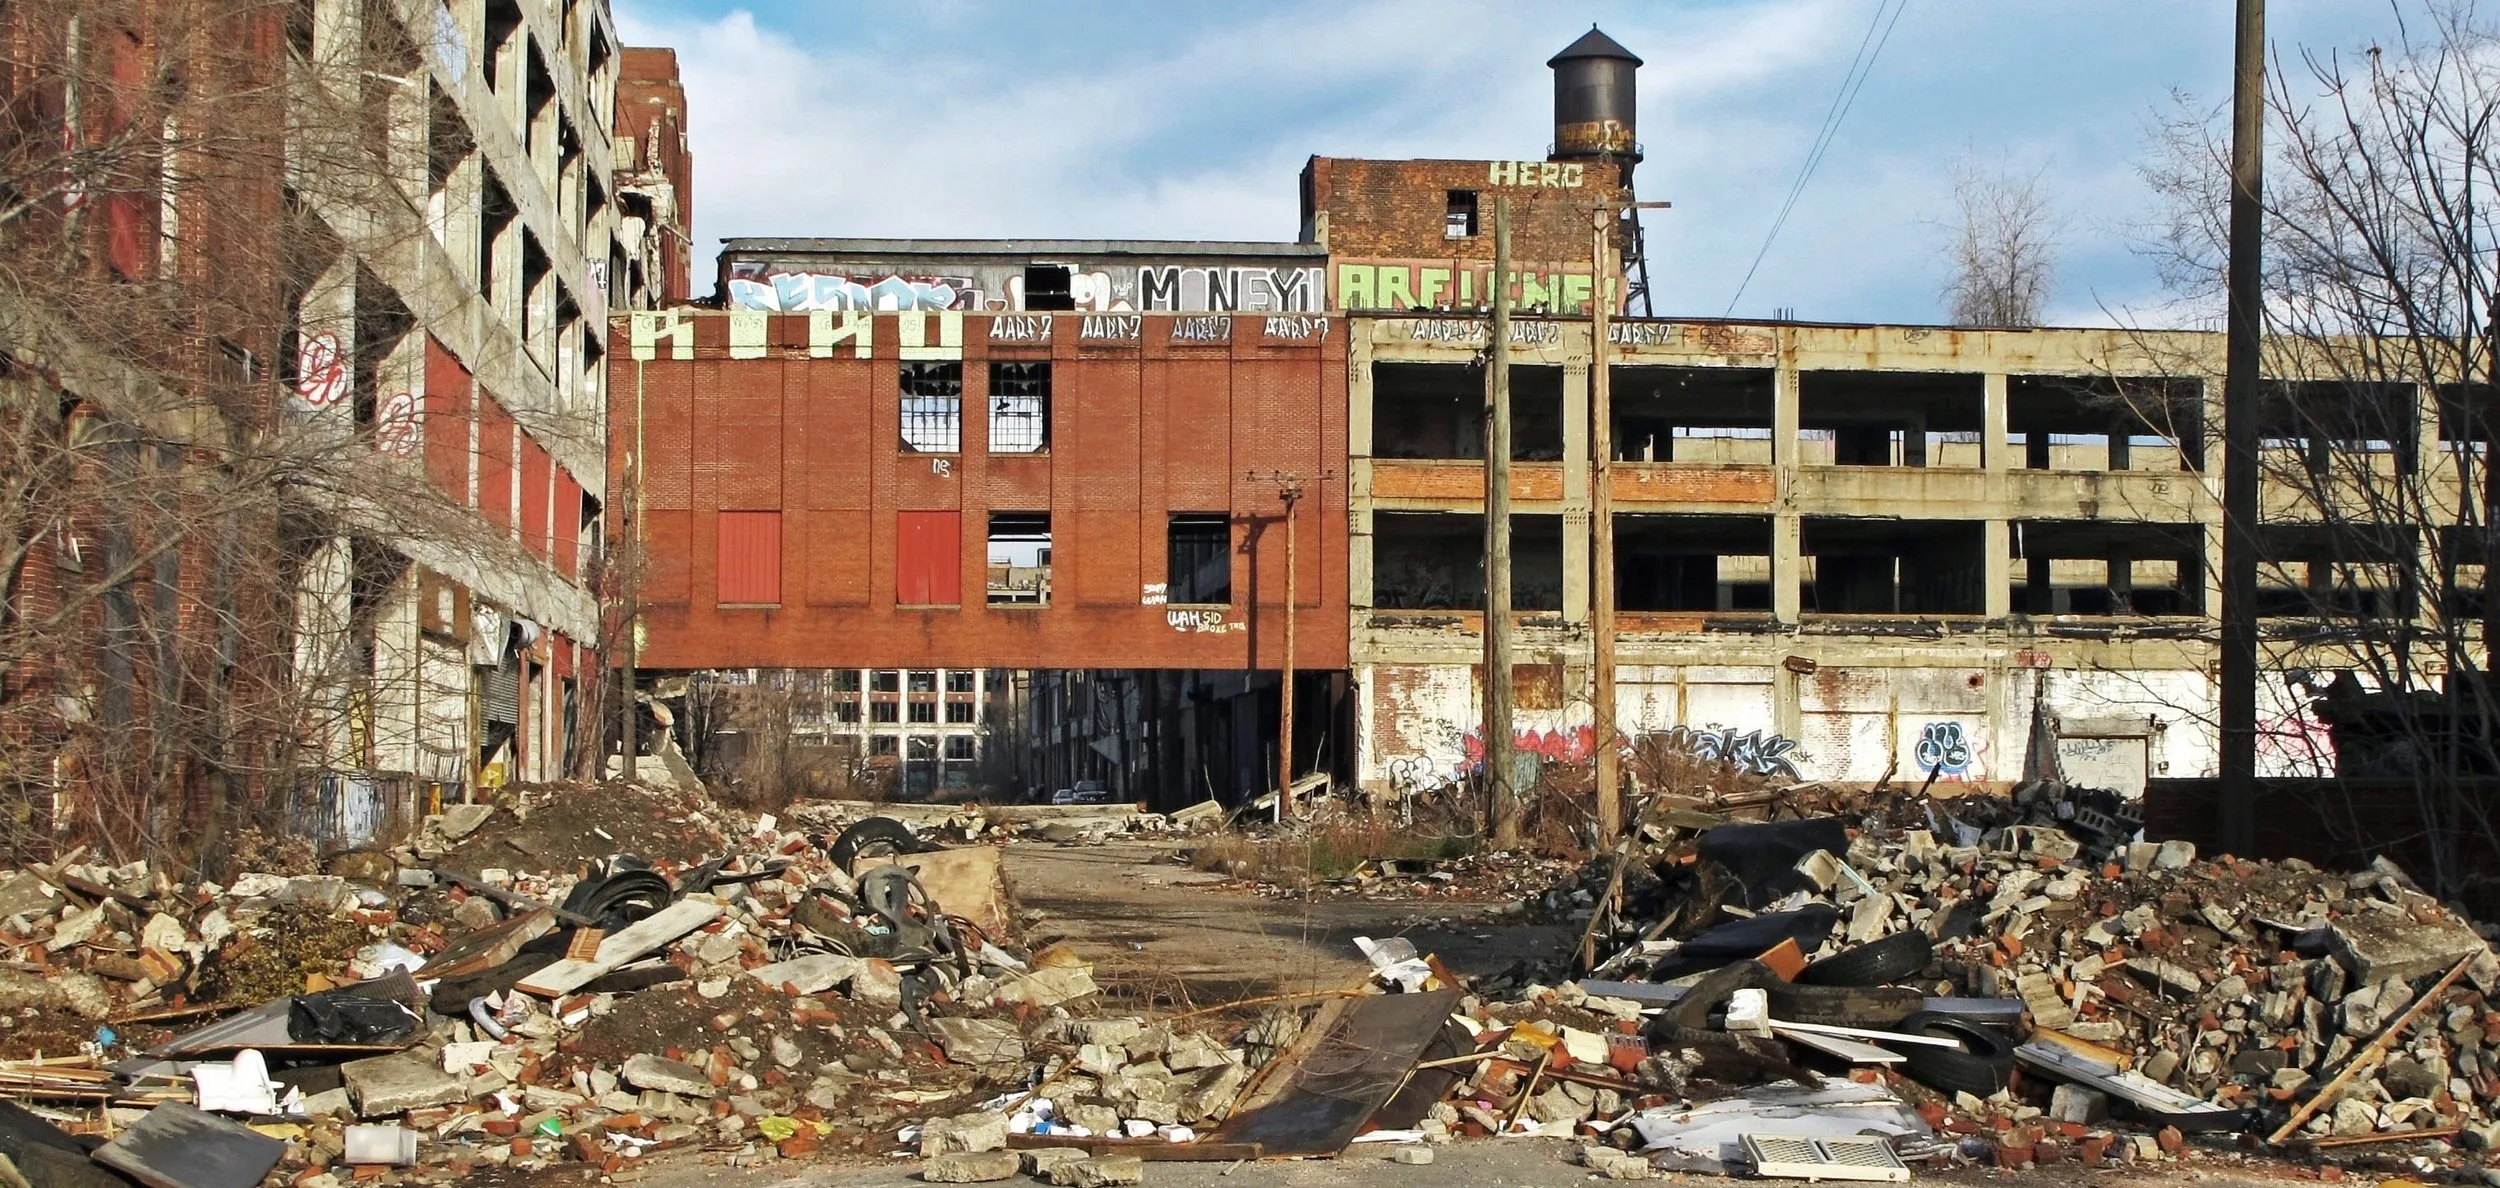
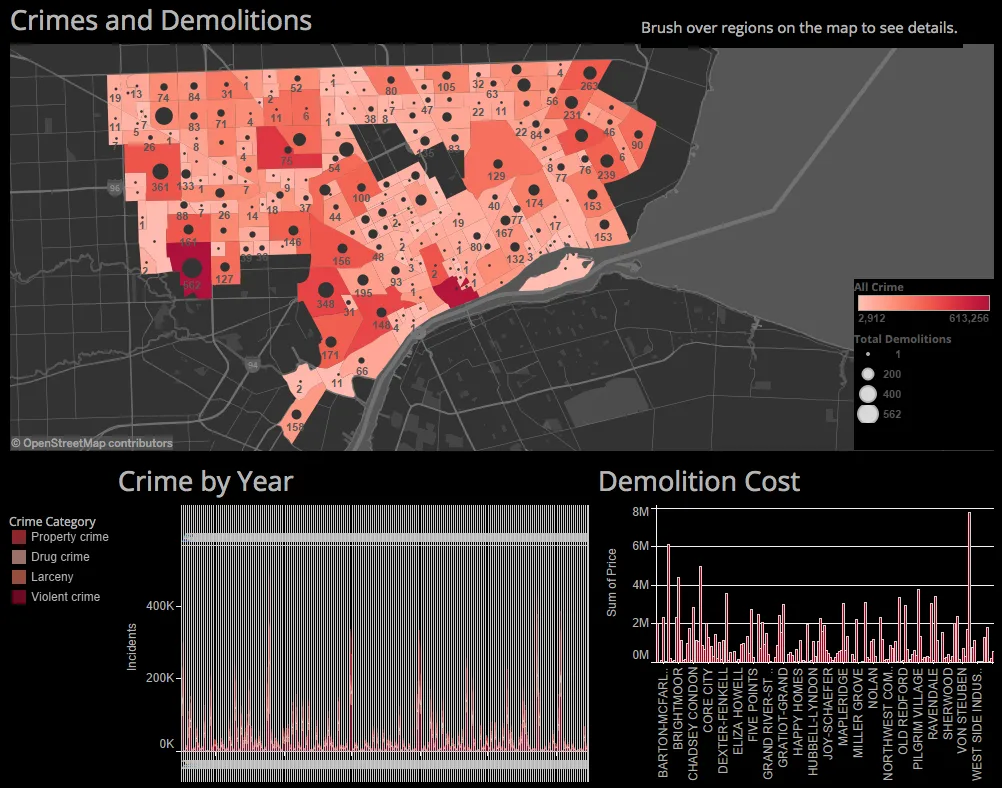
Detroit invested hundreds of millions of dollars to demolish vacant structures, hoping it would curb crime. We built an interactive dashboard so stakeholders could explore whether demolitions actually correlated with reductions in violent and property crime.
What I Led / Delivered / Highlights
- Acquired Detroit’s open crime dataset (2009–present) and cleaned it via Python scripts for analysis.
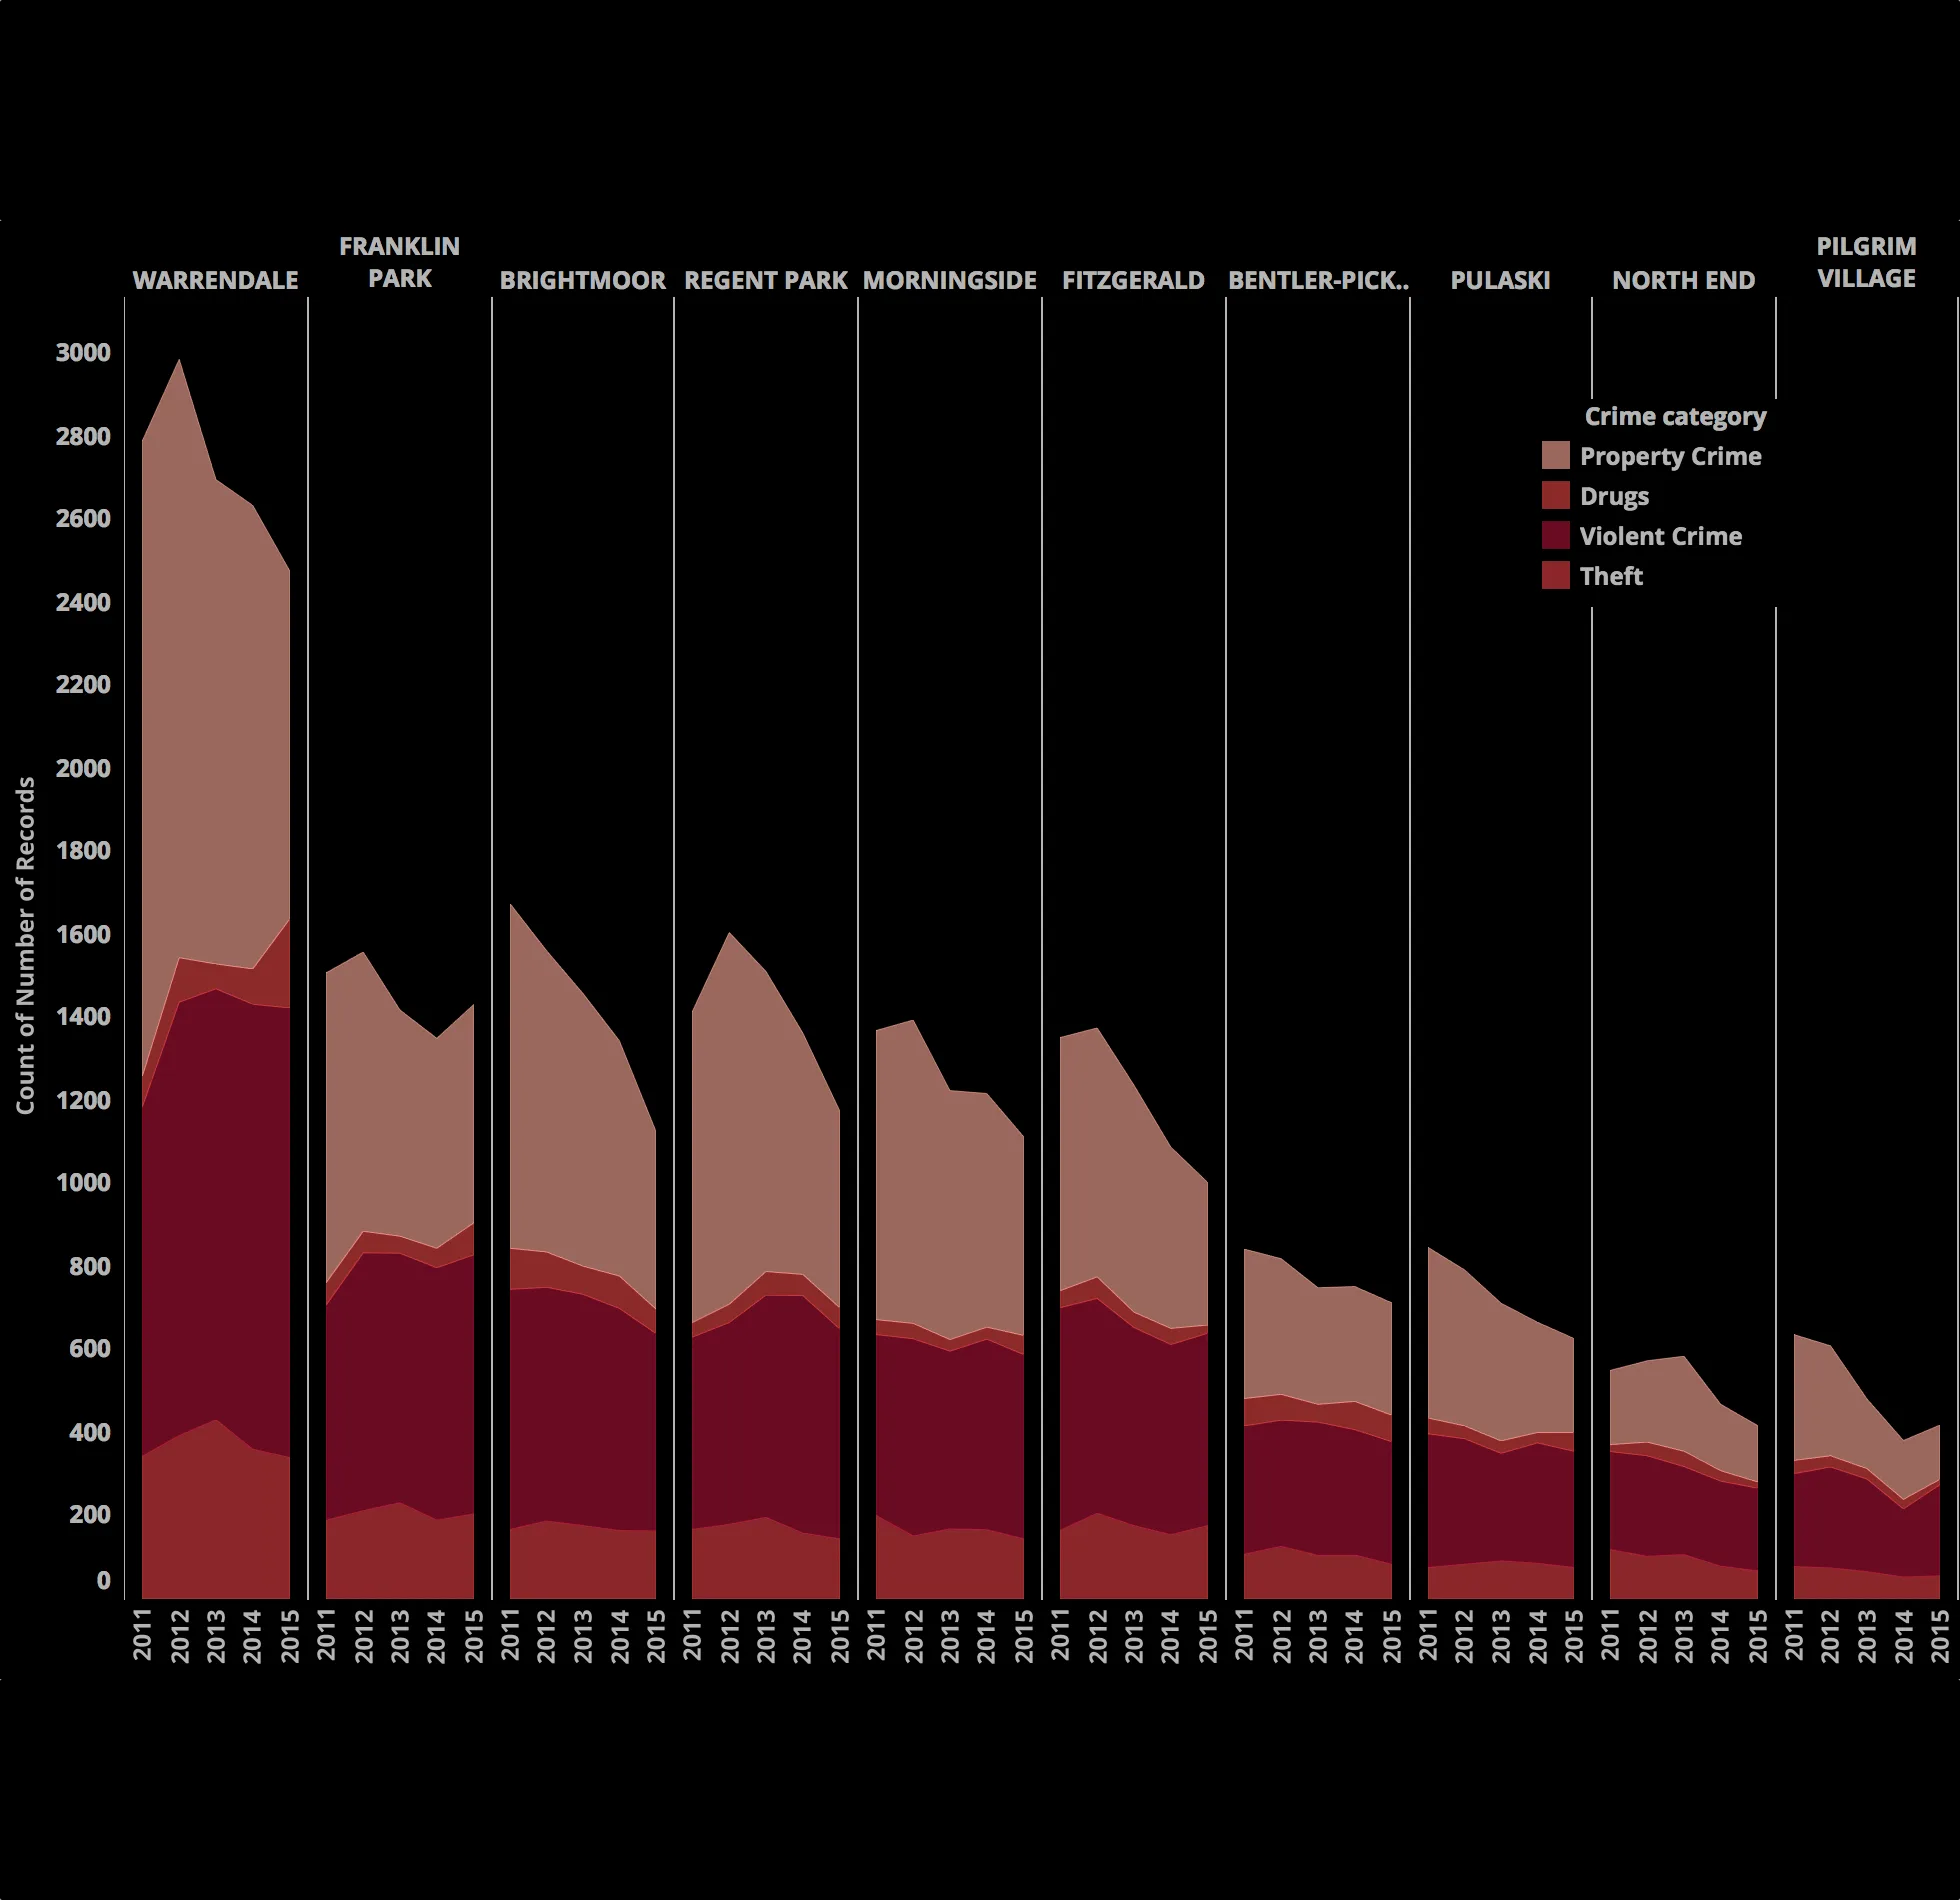
- Visualized patterns in Tableau, layering demolition activity over crime density maps, category trends, and neighborhood comparisons.
- Authored narrative insights about vacancy rates, health risks, and the financial burden of ongoing demolition programs.
Impact / Lasting Value / Takeaway
The project revealed that while property crime dipped in high-demolition neighborhoods, violent crime held steady or increased, calling into question the efficacy of demolition-only strategies and giving community advocates data to pursue alternative investments.