Terror Trending & Airline Security Delays
Quick Snapshot
- Role: Data analyst and visualization designer
- Team: Independent research project
- Customers: Aviation stakeholders exploring how global events affect U.S. airport operations
Mandate / Opportunity / Problem Scope
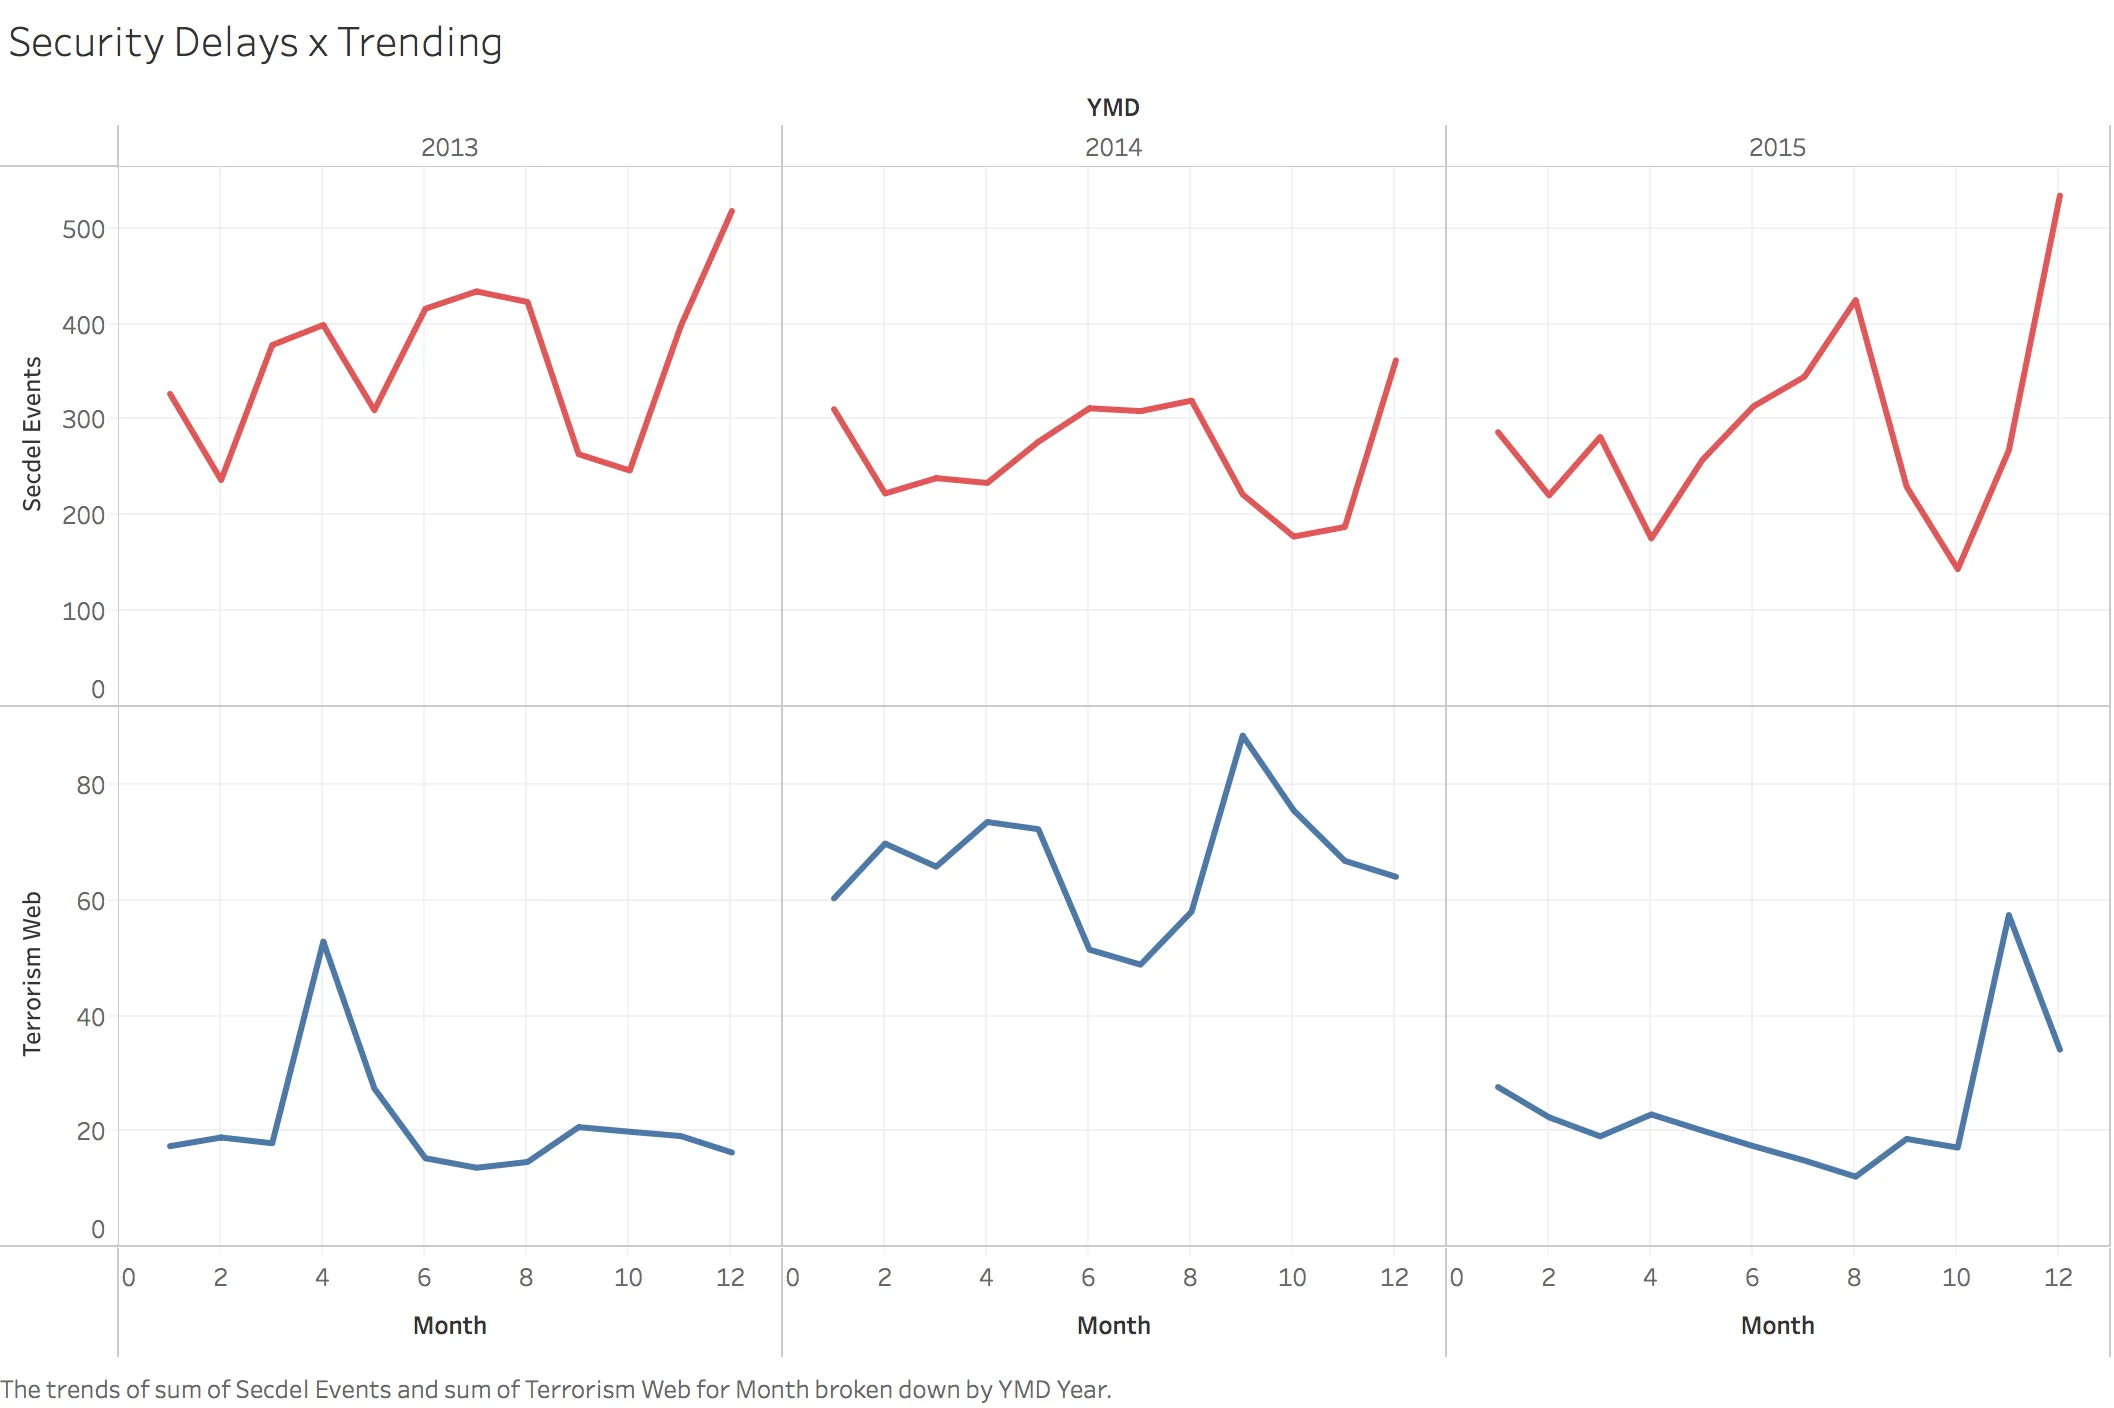
The airline industry feels the ripple of every global event. I set out to test whether spikes in terror-related search interest alone could predict increases in TSA-related delays across U.S. airports from 2013–2015.
What I Led / Delivered / Highlights
- Combined Bureau of Transportation Statistics delay data with Google Trends signals for terror-related topics.
- Wrote custom Python scripts to clean massive CSVs before building exploratory dashboards in Tableau.
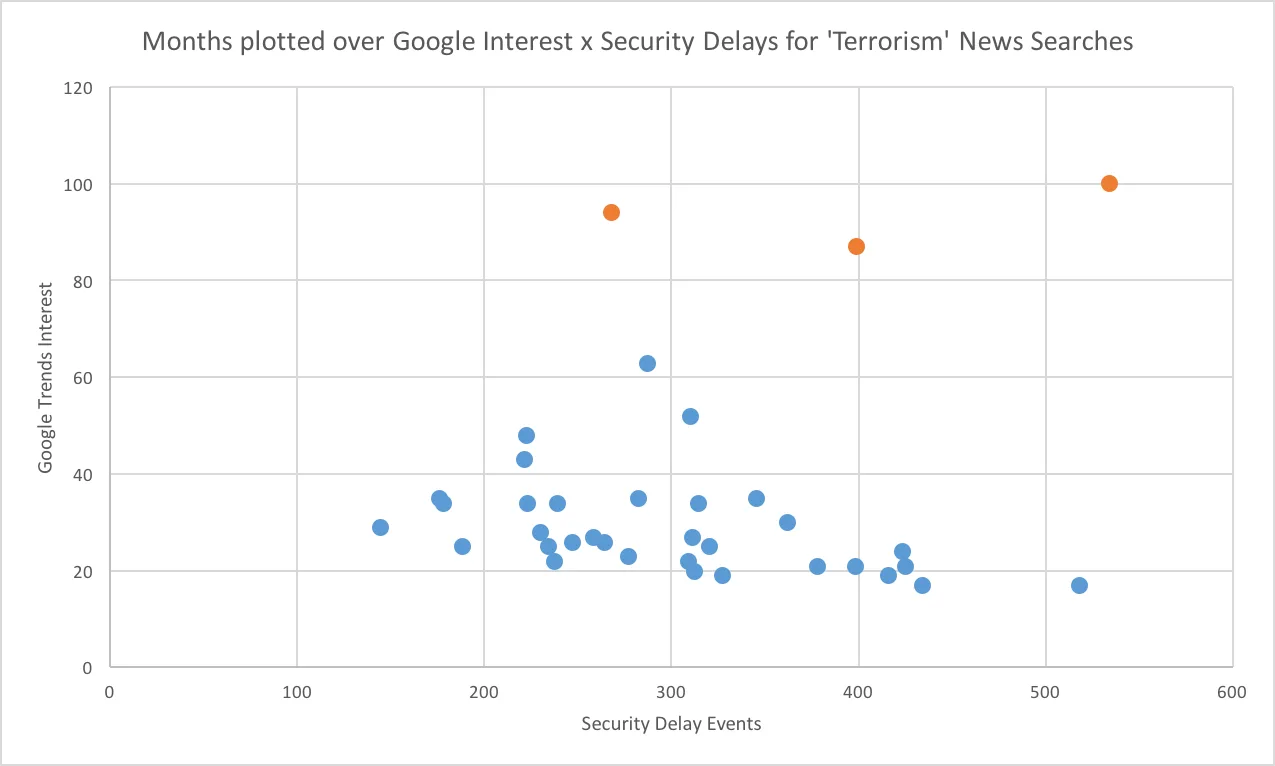
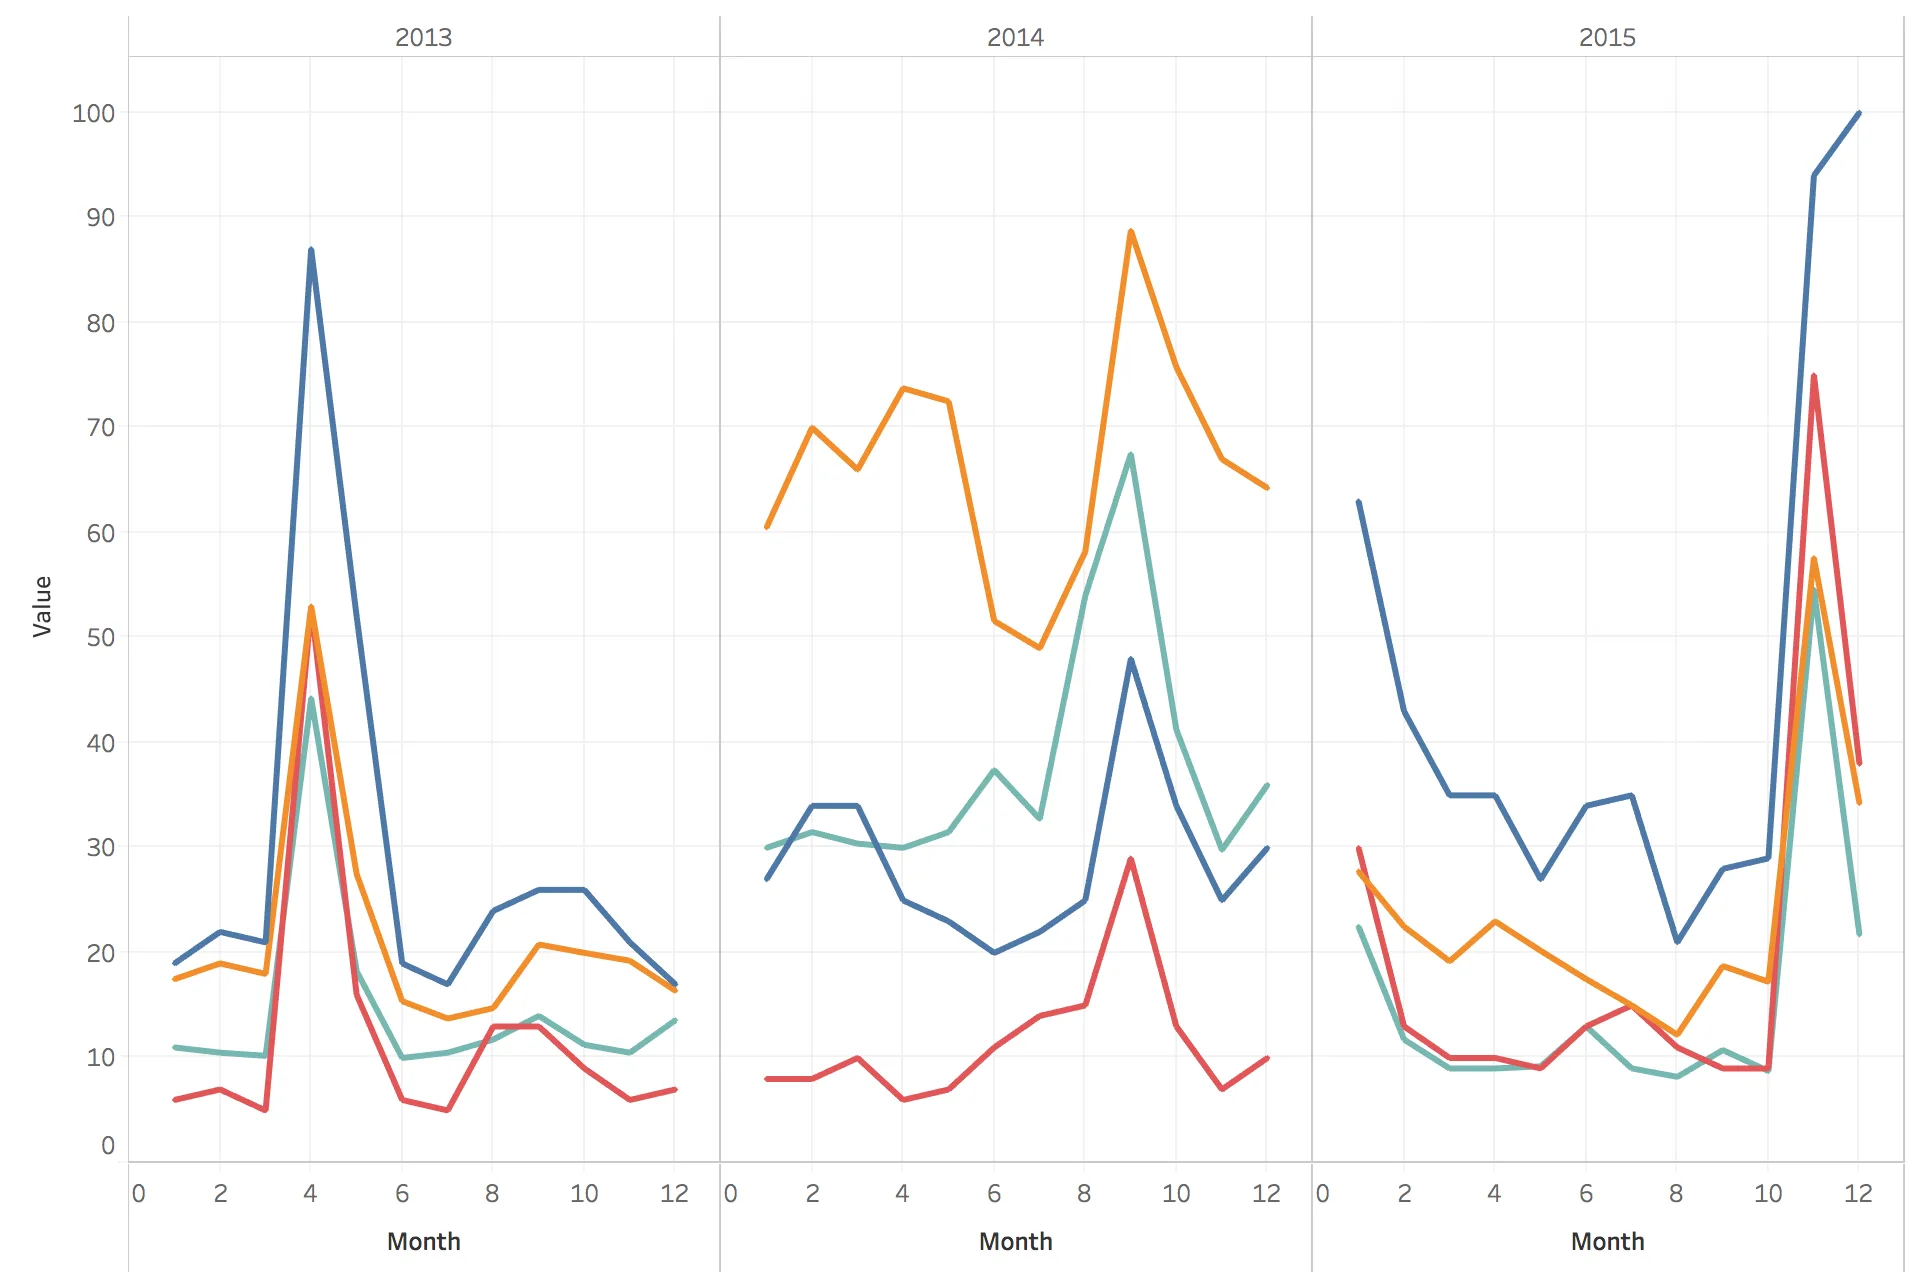
- Visualized scatterplots, time series, and correlation analyses to interrogate relationships between trending events and operational slowdowns.
Impact / Lasting Value / Takeaway
The analysis showed little correlation between terror trending and security delays, with only the largest terror shocks causing measurable disruption. The work provided a data-informed reality check for operational planning discussions.